

Last Updated on January 12, 2024 by Greg Gillson
Learning what birds are found in your local area has never been easier! You can use eBird to find out what birds are in your area now or in the past. The eBird database is free to all and uses real bird sightings gathered by bird watchers around the world. Your area can be as small as a local park, county or state, depending upon where you live. You can easily determine the common birds in your area or region with frequency bar charts for each week of the year.
eBird maps are more accurate and up-to-date than any range map in any book for determining what birds are found in your area. eBird will show you what birds are common in your county (US), thus you’ll be able to quickly determine the most common birds in your own backyard!
If you sign up to eBird (also free) you can access features such as a list of most common birds this month that you haven’t seen yet in any county or larger region. Likewise, you can have eBird notify you of rare birds in your region. Signing up also allows you to add your own sightings to the database. eBird keeps track of your personal lists for any area you wish.

What is eBird?
Created in 2002, eBird is described as “a real-time online checklist” program. At its most basic it archives bird checklists from birders around the world. Its power comes from adding over 100 million bird sightings to its database each year (source).
This citizen science program does not just collect bird sightings, though. It also displays bird sightings in various ways. Anyone can search for bird sightings of a particular species anywhere in the world. Or you may display all of the birds sighted in one particular place. Then you can combine these individual places, such as counties, states, and larger regions. They can help you know what birds to look for, at home or anywhere else.
The most powerful means of displaying local bird frequency in eBird is the county bar chart.
County bar charts
Go to eBird.org and select Explore:
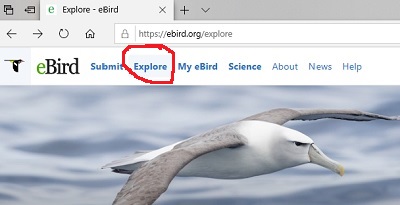 |
| Please click on image to enlarge |
Next you are supplied with several options. Now choose Bar Charts:
 |
| Please click on image to enlarge |
Select a country and region. Then, from the subregion menu, choose Counties. Scroll to the bottom of the page and click on the Continue button. All the counties are listed for you to choose from a drop-down menu. Scroll to find the county you want. Select it and click the Continue button. A bar chart is created for you from the area you selected.
What are bar charts?
Bar charts display information in a special graph. Here, let me show you an example from eBird. I followed the directions above and chose Pima County, Arizona. I just visited there last month, November 2019. Here is a sample section of the bar chart:
 |
|
Section of the Pima County, Arizona bar chart of birds
Please click image for larger view
|
During my trip I found Chipping Sparrows, Brewer’s Sparrows, and Black-throated Sparrows in the county during the last week of November. They are all expected according to the bar chart above.
The bars are thicker when the birds are more common. Bars are absent if no one has detected that species during that week of the month.
Each month has space for 4 bars, corresponding to the 4 weeks of the month. Weeks 1-3 have 7 days each (1-7, 8-14, 15-21). Week 4 can have 7-10 days, depending upon the month.
This is a chart for all years that anyone submitted records–even decades ago for some older birders who entered any checklists they may have written down years ago. But you can select any number of past years, even just one year, or whatever part of this year is complete.
It appears I could have found Black-chinned Sparrows somewhere in the county. Maybe I could have found Grasshopper Sparrow or Clay-colored Sparrows, too, though they are less common.
Note that these are bar charts of frequency–the number of times the species is found on every checklist. This is NOT a chart of numerical abundance. I saw a large flock of Chipping Sparrows, but only singleton Black-throated Sparrows, but the frequency per checklist is the same: found or not found on each checklist.
Got it? Good! Now, if I wanted to figure out where to go to find those Grasshopper and Clay-colored Sparrows that should have been present, I could use the map feature.
Maps
This time from the Explore menu I chose Species Maps. I’m looking for Grasshopper Sparrows in Pima County, Arizona. The bar chart showed they should have been present in Pima County when I visited in November. But I didn’t see any.
The bar chart did indicate they weren’t seen as often as the sparrow species I did see. So maybe, it was just chance that I didn’t see any Grasshopper Sparrows. Or… perhaps I wasn’t in the right location or habitat.
After selecting Explore>>Species Map I chose the bird name and location. The text entry bars auto-fill as I type. I select Grasshopper Sparrow from the species list. I type in “pima” in the Location search bar and select Pima County from the list (“Pima County, AZ, USA”).
Then I get a map showing sightings. If more than 1000 locations are on your map you get rectangular purple blocks on the map wherever the species was seen. The darker the purple, the more sightings in each block.
 |
|
Map of Pima county, Arizona showing Grasshopper Sparrow sightings.
Click for larger view
|
I’d like to see individual sightings, so I select “Show Points Sooner” checkbox.
 |
|
Map of Grasshopper Sparrow sightings in Pima County, Arizona
Please click on map for larger view
|
Well, that explains it. I was birding at Organ Pipe Cactus National Monument, way over on the left edge of this map. The Grasshopper Sparrow sightings are all over on the right side of the map near Grass Valley and Patagonia, well south of Tucson. No wonder I didn’t see any!
See those red location marks? Those are sightings made of the species within the last 30 days. You can click on any of the sighting marks on the map to see the checklist that shows all the species seen at that location.
Hotspots
On the map above you may notice smaller solid markers. Those are personal locations where someone recorded a checklist of birds. Those could be a person’s backyard or just a bird noticed once while driving by. Such checklists might only include one species of note, but are more valuable if they include all the birds seen at that location during one timed visit.
The larger markers with the white flame design inside are Hotspots. These are public areas where many birders are likely to go and submit checklists for. Hotspots can be a park or wildlife refuge, pond, viewpoint, trail or any publicly accessible location where birders repeatedly return to watch birds.
For every Hotspot you can create bar charts of frequency. You may find that some local Hotspots, such as a small park, may only have a few checklists at a couple times of years. It’s fun to check these out and add missing weeks to the bar chart, and missing species to the Hotspot. Some Hotspots will be visited by birders several times nearly every day of the week.
When I prepared to visit Arizona last month, I checked out all the Hotspots in the area. Then I made plans to visit several of them, making sure to create new checklists to add to the data. You could do the same thing with Hotspots near your own home. You may find that there are exciting birds near your home that you knew nothing about!
Photos and sounds
You can click on any bird name on a checklist and be taken to a species account with maps, photos, and sound recordings. You can refine these by choosing a smaller territory. Then you can see only photos from a certain region or area.
Alternatively, from a checklist on a map you may have followed, click on the Hotspot name to be taken to the overview page for that area. On the Hotspot overview you can see recent sightings, and several bar chart checklists, including one with photos–the Illustrated Checklist. I like these because it is sometimes easy to add photos of new species to less well visited Hotspots.
Target birds
One of the benefits to signing up to eBird is that you can sign up to receive email when rare birds are seen in any area you choose.
If you add your own checklists, you can receive notification of any species you haven’t seen yet. That includes birds you have never seen anywhere, birds you have never seen in just the defined area, or even birds that you haven’t seen yet this year. Many birders start new lists every year.
The Target birds selection will give you a list of birds in your target area you haven’t seen ordered by the most likely first! You can get the answer to, for instance: “What bird of those I haven’t seen in the county is easiest to find?” Or, “What bird that I haven’t seen in the state is most likely in the month of March?”
To benefit from this feature, though, you have to add sightings to eBird. Here’s how:
Adding to the data
Sign up to eBird and go birding!
Keep track of how long you spent and how far you traveled. To be most useful, break up any trips to 5 miles at most. Add a new checklist any time you change habitats, locations, or cross county lines! Record every species you can identify. Keep track of the number of individual birds of each species you see. This is optimum. You can keep less recorded data. But the more precise your checklist the more useful it is to science. The data each checklist absolutely needs is an exact location and an exact date.
Too much work? There is nothing wrong with a 5 minute count out the window of birds at your feeder. That’s a Stationary Count, and is very valuable. You could do several such counts in a day. Birders love to find rare birds or travel to record rare birds that others have found. But there is actually more scientific benefit in daily records of common birds from a small location, repeated over time. Your backyard may not be as exciting as a remote jungle, but regularly recording common birds at your feeder may actually produce more scientific insights when combined with other people doing the same across the country.
Beginners should not be afraid of making mistakes in identification. The checklist entry program has a list of expected birds to chose from. If you enter an unexpected bird it will ask you to provide details. Then a real person, a local expert, will vet the record. For accuracy, only vetted records of birds will be added to the eBird database public output (bar charts and map points).
It may seem uncomfortable to have someone question you about what you saw. But look at it as a learning experience in improving your birding and observation and description skills. Size, shape, behavior, plumage coloration. Describe the field marks. Remember, describe the bird–tell the Reviewer only what you saw (shape, colors, behavior), don’t say what you concluded (name of bird) or how positive you were, or that it looked just like the picture in the book. Even if you are able to provide a photo, a written description is still very useful.
Your written description or photo of an unusual or rare bird becomes a scientific specimen record–just like in a museum. So it needs to be accurate.
It is fun to add a new bird to your county list or a new early or late date for your area. In either case you’ll need to write a description of the bird.
Who knows? In a year or two you might be the expert! Then other people may come to you asking: “What birds are in this area?”
Wrapping Up
eBird’s strengths depend on your specific needs and goals. Here’s a breakdown to help you evaluate its effectiveness:
- Huge dataset: eBird boasts the world’s largest biodiversity-related citizen science project, with over 1 billion bird observations logged from millions of users globally. This vast dataset provides valuable insights into bird populations, migration patterns, and habitat use.
- Easy to use: The eBird platform is user-friendly, with beginner-friendly options for casual birders and detailed features for experienced users.
- Mobile app: The eBird mobile app makes recording observations quick and convenient, ideal for on-the-go birding.
- Data validation: eBird implements data quality control measures to ensure the reliability of its data, making it useful for research and conservation efforts.
- Educational resources: eBird provides a wealth of educational resources, including species profiles, guides, and tools, helpful for learning about birds and improving identification skills.
- Community aspect: eBird fosters a vibrant community of birders, allowing users to connect, share sightings, and participate in citizen science projects.
In my opinion, eBird is an invaluable resource for birders to record, research and plan their birding journey.
Frequently Asked Questions
What is the eBird quiz?
The quiz is an identification game based on photos and sounds uploaded to eBird. While it can be frustrating at times as the photos are of very variable quality, it is great fun and a fantastic way to learn about birds in your own area or any where in the world!
You can find a link to the quiz page here.
How reliable is eBird?
eBird is very reliable with many checks to ensure the data is accurate. However, there may be a few weaknesses:
- Potential for bias: Like any citizen science project, eBird data can be geographically and taxonomically biased, with more observations from developed areas and common species. This can affect the reliability of comparisons across regions or for rare birds.
- Observer skill variability: While data quality measures exist, some inaccurate observations may still slip through, especially from inexperienced users. It’s important to consider the observer’s skill level when assessing individual sightings.
- Location errors: Occasional errors in GPS location data can occur, affecting the accuracy of spatial analyses.
What is the difference between eBird and Merlin?
Both eBird and Merlin are fantastic tools for birders, but they serve different purposes:
eBird:
- Focus: Citizen science platform and database
- Purpose: Collect and share bird observations to document distribution, abundance, and migration patterns for research and conservation.
- Features:
- Log your bird sightings with details like species, location, date, and number of individuals.
- Explore existing bird observations worldwide in various formats like maps, checklists, and graphs.
- Contribute to citizen science projects and analyze bird data trends.
- Connect with other birders and share your passion for birds.
Merlin:
- Focus: Bird identification app
- Purpose: Help you identify unknown birds you see or hear using interactive tools and features.
- Features:
- Answer questions about your sighting, like location, habitat, size, color, and behavior.
- Listen to bird songs and calls to compare with what you heard.
- See photos and illustrations of similar species for a narrowed-down identification.
- Save your identified birds in a personal list and track your sightings over time.
Here’s a table summarizing the key differences:
| Feature | eBird | Merlin |
|---|---|---|
| Main purpose | Citizen science and data collection | Bird identification |
| Features | Logging bird sightings, exploring data, citizen science projects, community | Interactive identification tools, sound recordings, image comparisons, personal checklists |
| Data focus | Large, global dataset of bird observations | Individual bird sightings you encounter |
| User role | Contributor and consumer of data | Consumer of identification resources |
Which one is right for you?
- Use eBird: If you want to contribute to bird research and conservation by reporting your sightings and exploring bird data.
- Use Merlin: If you want to quickly and accurately identify birds you see or hear and learn more about individual species.
Related
To get you started on common backyard birds, I have created posts listing the most common backyard birds for every state.
Please check out the Article Index and scroll all the way to the bottom to find your state.

thank you for all the great information. I refer to it often.
Thank you. This isn't one of the more popular pages on this site. So I'm glad to find someone who benefits and appreciates it!